Operator | Airport | FBO | MRO | OEM | Charter | Interiors | Avionics | Training | Inflight
United States:
March 2019 and Q1 2019 pre-owned business jet, turboprop, piston, helicopter, and commercial market report
JETNET LLC has released March 2019 and first quarter 2019 results for the pre-owned business jet, business turboprop, piston, helicopter, and commercial airliner markets.
Key worldwide trends for all aircraft market segments were compared from March and 1st quarter of 2019 to March and 1st quarter of 2018. Generally, inventories are down across the board, except for Piston Aircraft. Lower inventories are certainly good news.
However, as this story goes to print, there is a pronounced decline in Q1 retail sales and leases vs. one year ago. For all fixed and rotary wing aircraft combined, JETNET reports an overall 25% reduction in sales for Q1 2019 vs. Q1 2018. With regards to business jets, the decline is 19.9%. These figures could prove to be fluid, as notice of a few late quarter transactions may yet trickle in. Still, it must be acknowledged that the late-year stock market correction and prolonged U.S. government shutdown (Dec. 22 through Jan. 25) had a deleterious impact on the pre-owned market.
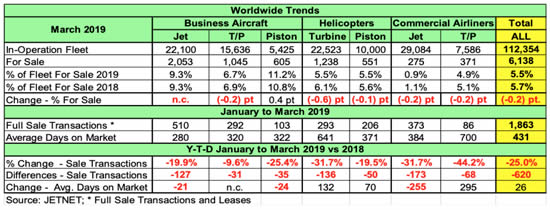
Across all aircraft sectors, there was a total of 6,138 or 1.9% fewer aircraft for sale in the quarterly comparison. This was a difference of 120 fewer aircraft and helicopters for sale.
Interestingly, Fleet For-Sale percentages for business jets showed the same 9.3% for 2019 and 2018 in the quarterly comparison.
Total full sale transactions were down by 620 aircraft and helicopters. The Top 3 were Commercial Airliner jets (-173), Turbine Helicopters (-136), and Business Jets (-127) totaling 436 or 70% of the total decline in the quarterly comparisons.
Aircraft
Business Jet full sale transactions showed a 19.9% decrease, and are taking less time to sell (21 fewer days) than last year. However, Business Turboprops showed a decrease of 9.6% in sale transactions, and are selling over the exact same time (320 days) comparing 2019 and 2018.
Turbine Helicopters and Commercial Airliners saw the same percentage decreases in sale transactions in the first quarter comparisons, at -31.7%. However, Turbine Helicopters took 132 more days to sell, whereas it took 265 fewer days for Commercial Airliner jets to sell.
Commercial Airliners reported by JETNET include the numbers for sale for both Commercial Jets (including airliners converted to VIP) and Commercial Turboprop aircraft. Interestingly, Business Jets (at 510) and Commercial Jets (at 373) accounted for 47% of the total full sale transactions (1,863). The total full sale transactions were down 25%, with business turboprops showing the lowest percentage decrease of 9.6%. Note: JETNET does not cover all piston aircraft inventory or sales. The piston models that JETNET tracks are: Baron 58 series, Cessna 414 and 421 series, Diamond DA62, and the Piper high-end singles M350, Malibu, Matrix, and Mirage.
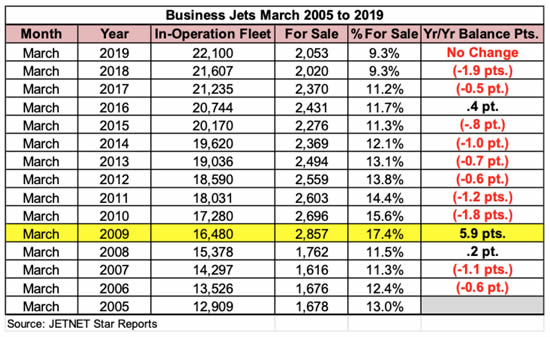
The March-ending changes from 2005 to 2019 (15 years) were analyzed for the business jet in-operation fleet, number for sale, percentage for sale, and the year-over-year point change (9.3% less 11.2% equals -1.9 points decrease). March 2016 is the first March-ending period that the percentage for sale and year-over-year points increased since March 2009. Interestingly, the March 2018 number of aircraft for sale (2,020) is the lowest number since March 2008. While the percentage for sale remained the same at 9.3% comparing 2019 to 2018, the number of for sale increased by 33 or 1.6% to 2,053. In 2009, as the recession struck, there was an explosion of 62%—or 1,095—more business jets listed for sale compared to the year prior. What then followed was a trend toward recovery, as the market steadily shed inventory and moved closer to again being a healthy “seller’s market”. While this decrease in units for sale is a far cry from the pronounced spike of 2009, Q1 2019 and Q1 2018 at 9.3% must be regarded as a positive step in the direction of a stabilized for-sale inventory.
Pre-Owned Full Retail Sale Transaction Trends
Real gross domestic product (GDP) increased 3.2 percent in the first quarter of 2019, according to the “advance” estimate released by the U.S. Bureau of Economic Analysis. In the fourth quarter of 2018, real GDP increased 2.2 percent.
There were 620 fewer transactions (-25%) in the first quarter of 2019 than the first quarter of 2018. This decline was not expected, as the U.S. GDP increased 3.2 percent. Interestingly, two thirds of the decline in the 1st quarter was in the U.S.
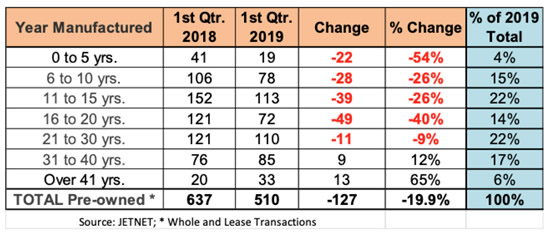
Comparing the Pre-owned Business Jet Retail Transactions (Whole & Leases) for 1st quarter 2018 and 1st quarter 2019 by Age group reveals there were 127, or 19.9%, fewer Pre-owned Business Jets sold. Two observations are:
-
Older-aged aircraft (age groups 31 to 40 and over 40 years) saw increases in retail transactions.
-
Younger aircraft (all age groups from 0 to 30 years) saw declines in the number of business jets sold, ranging from 11 to 49 fewer aircraft. The youngest group (0 to 5 years and 6 to 10 years), while representing only 19% of the total of 510 sold transactions, declined by 50 business jets sold in the quarterly comparisons.
Note: Most brokers will explain the reduction of pre-owned sales in 1st quarter 2019 as not so much about declining demand as it is about a lack of aircraft to choose from for the discerning buyer at the right price.
More information at jetnet.com

![]()
BlueSky Business Aviation News | 16th May 2019 | Issue #511
Share this article