WINGX Global Market Tracker:
Week 6-24 sees solid US market, only 2% down from 2023 peaks
For week 6, through 11th February 2024, global business jet activity was down 2% compared to the week 6, 2023, according to WINGX`s weekly Global Market Tracker published today.
There were 66,974 business jet sectors operated in the last week, up 4% compared to week 5 2024. So far this year (1st January-11th February), global business jet is trending 3% below last year, up 41% compared to 2019*.
During the same period, scheduled airline sectors are trending 6% up on last year, 13% up on 2019.
1st January-11th February activity by sector, compared to previous years.
(Business aviation includes business jets & turboprops).
[click image to enlarge]
*WINGX added new sources for flight data in Feb-24, backdated to Jan-23, which has modestly inflated trends vs 2019.
United States
Week 6 bizjet demand in the US bumped up from Week 5 by 2%, down slightly, by 920 flights, compared to Week 6 2023. The weekly YOY trend is stronger than the last 4-week trend which is down 4%.
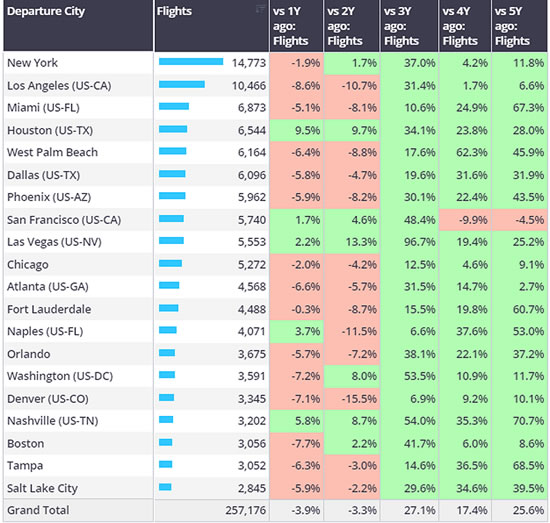
Five of the top 20 busiest cities in the US saw some increase YOY, notably Houston, flights up by 9.5%, trending up by 28% compared to same week in 2019. Of the cities with declining year on year activity, Los Angeles saw a sizeable drop, departures down by 9%. Flights out of Miami are trending up by 67% compared to 2019.
Busiest cities for business jet departures, 1st January-11th February 2024, compared to previous years.
[click image to enlarge]
Teterboro-Palm Beach is the busiest bizjet airport pair this year, flights are 1% behind last year, 35% ahead of 5 years ago. NetJets is the busiest operator on the route, accounting for 128 of the 418 bizjet flights. Several airport pairs are seeing flight activity >100% growth compared to 2019. 167 bizjet flights between KPPI – KOPF, 114% growth vs 2019. Elsewhere flights between KSDL – KSNA and KPBI – MYNN are 3% and 4% behind last year respectively, although 101% and 117% growth vs 5 years ago respectively.
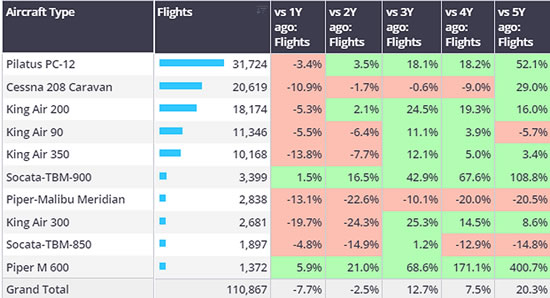
Focussing on the turboprop market, US turboprop sectors have fallen 8% compared to last year, although 20% ahead of 2019. Los Angeles is the busiest departure city for turboprops, over 500 more departures compared to second ranked Pheonix. Bucking the region decline is Corpus Christi, the metro area airports seeing 29% more turboprop departures compared to last year. Overall, the Pilatus PC-12 is the busiest turboprop type year-to-date, flying just under 32,000 sectors so far. However, all King Air variants combined have flown over 4,00 sectors.
Top US turboprop aircraft types 1st January 2024-11th February 2024.
[click image to enlarge]
Europe
Year-to-date, European business jet activity has fallen 3% compared to last year, still 4% above pre-pandemic 2019.
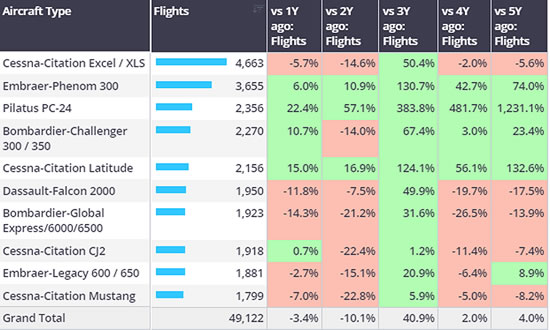
The Cessna Citation Excel / XLS is the busiest bizjet type in Europe this year, sectors are 6% behind last year and even 6% behind 2019. Pilatus PC-24 sectors continue to reach new heights, likewise Embraer’s Phenom 300 is busier than any of the last 5 years.
Sweden is the busiest country for PC-24 departures, followed by Switzerland, the type’s origin manufacturing base. PC-24 Departures in Sweden are almost exclusively for domestic air ambulance operations.
Europe business jet aircraft types, 1st January-11th February 2024 vs previous years.
[click image to enlarge]
The ski season is seeing its annual peak in bizjet visitors to airports nearby the top alpine resorts. For example, Geneva has seen 1,568 bizjet arrivals in the last 5 weeks, and similarly to Chambery, is trending down by 5% compared to early 2023. Sion has seen an increase, up 6% compared to last year. Annecy has seen the largest YOY bounce, 107 arrivals, up by 23% compared to Jan-Feb 2023.

“There were 66,974 business jet sectors operated in the last week, up 4% compared to week 5 2024.
"So far this year (1st January-11th February), global business jet is trending 3% below last year, up 41% compared to 2019.”
Richard Koe, MD, WINGX.
WINGX GmbH
Lilienstraße 11
20095 Hamburg
Germany.
+49 40 23 96 85 05
BlueSky Business Aviation News | 15th February 2024 | Issue #735

| © BlueSky Business Aviation News Ltd 2008-2024 |


